For FMCG & CPG brands.
From production run to retailer shelf.
MOQs, distributor and retailer margins, discounts and regional sales in one model, so you can see what each unit earns after everyone's cut.
10k-unit run at $2.10 a unit, $6.50 shelf price, 45-day retailer payment terms
39% margin to the brand after channel and trade spend.
- Shelf priceRecommended retail price in grocery stores.$6.50Per unit
- Channel marginsRetailer takes 30%, then distributor 20% of the rest.$2.86Per unit
- Trade spendTwo promotions a quarter at 6% of net price.$0.22Per unit
- Unit COGSIngredients, packaging and co-packing fee.$2.10+4%vs last run
Startup Suite is an AI planning workspace that helps FMCG and CPG founders model the channel margin stack, MOQs, and trade spend from production run to retailer shelf.
This page is for FMCG and CPG founders modelling margins, production cash, and channel pricing.
- Retail & wholesale pricing
- Volume by region & channel
- Trade & volume discounts
- BOM / production cost
- MOQs & landed cost
- Distributor & retailer margins
- Channel margin-stack model
- Production & cash plan
- Trade-spend & promotion plan
- Scenario Workbench
- Forecast Engine
- AI mentors
Where CPG margin and cash get lost
You can't see your net per unit
By the time distributor and retailer margins come out, you're not sure what you keep.
MOQs tie up your cash
A production run drains the bank, and the cash doesn't come back for months.
Trade spend isn't in the plan
Promotions and volume discounts erode margin in ways you can't see in advance.

Model the CPG margin stack and production cash
Edit the BOM, run size, and channel margins and watch net margin and the cash a production run ties up, then test a supplier increase.
Roll ingredients and packaging into a unit cost, take off distributor and retailer margins, and see how much cash each minimum order ties up.
- Assumptions
- Model
- Scenarios
- Mentor Review
- Outputs
AI mentorCurrent BOM and channel mix: margin holds to net and the run pays back within the cycle.
One model, connected from the first input to the final output
Change BOM cost or run size and net margin and production cash rerun. An ingredient price rise sits next to a bigger run, and the mentor flags a run that drains cash.
Edit BOM cost and MOQ size
Net margin and production cash recompute
Compare base, ingredient-up, and run-size
Flags when a production run drains cash
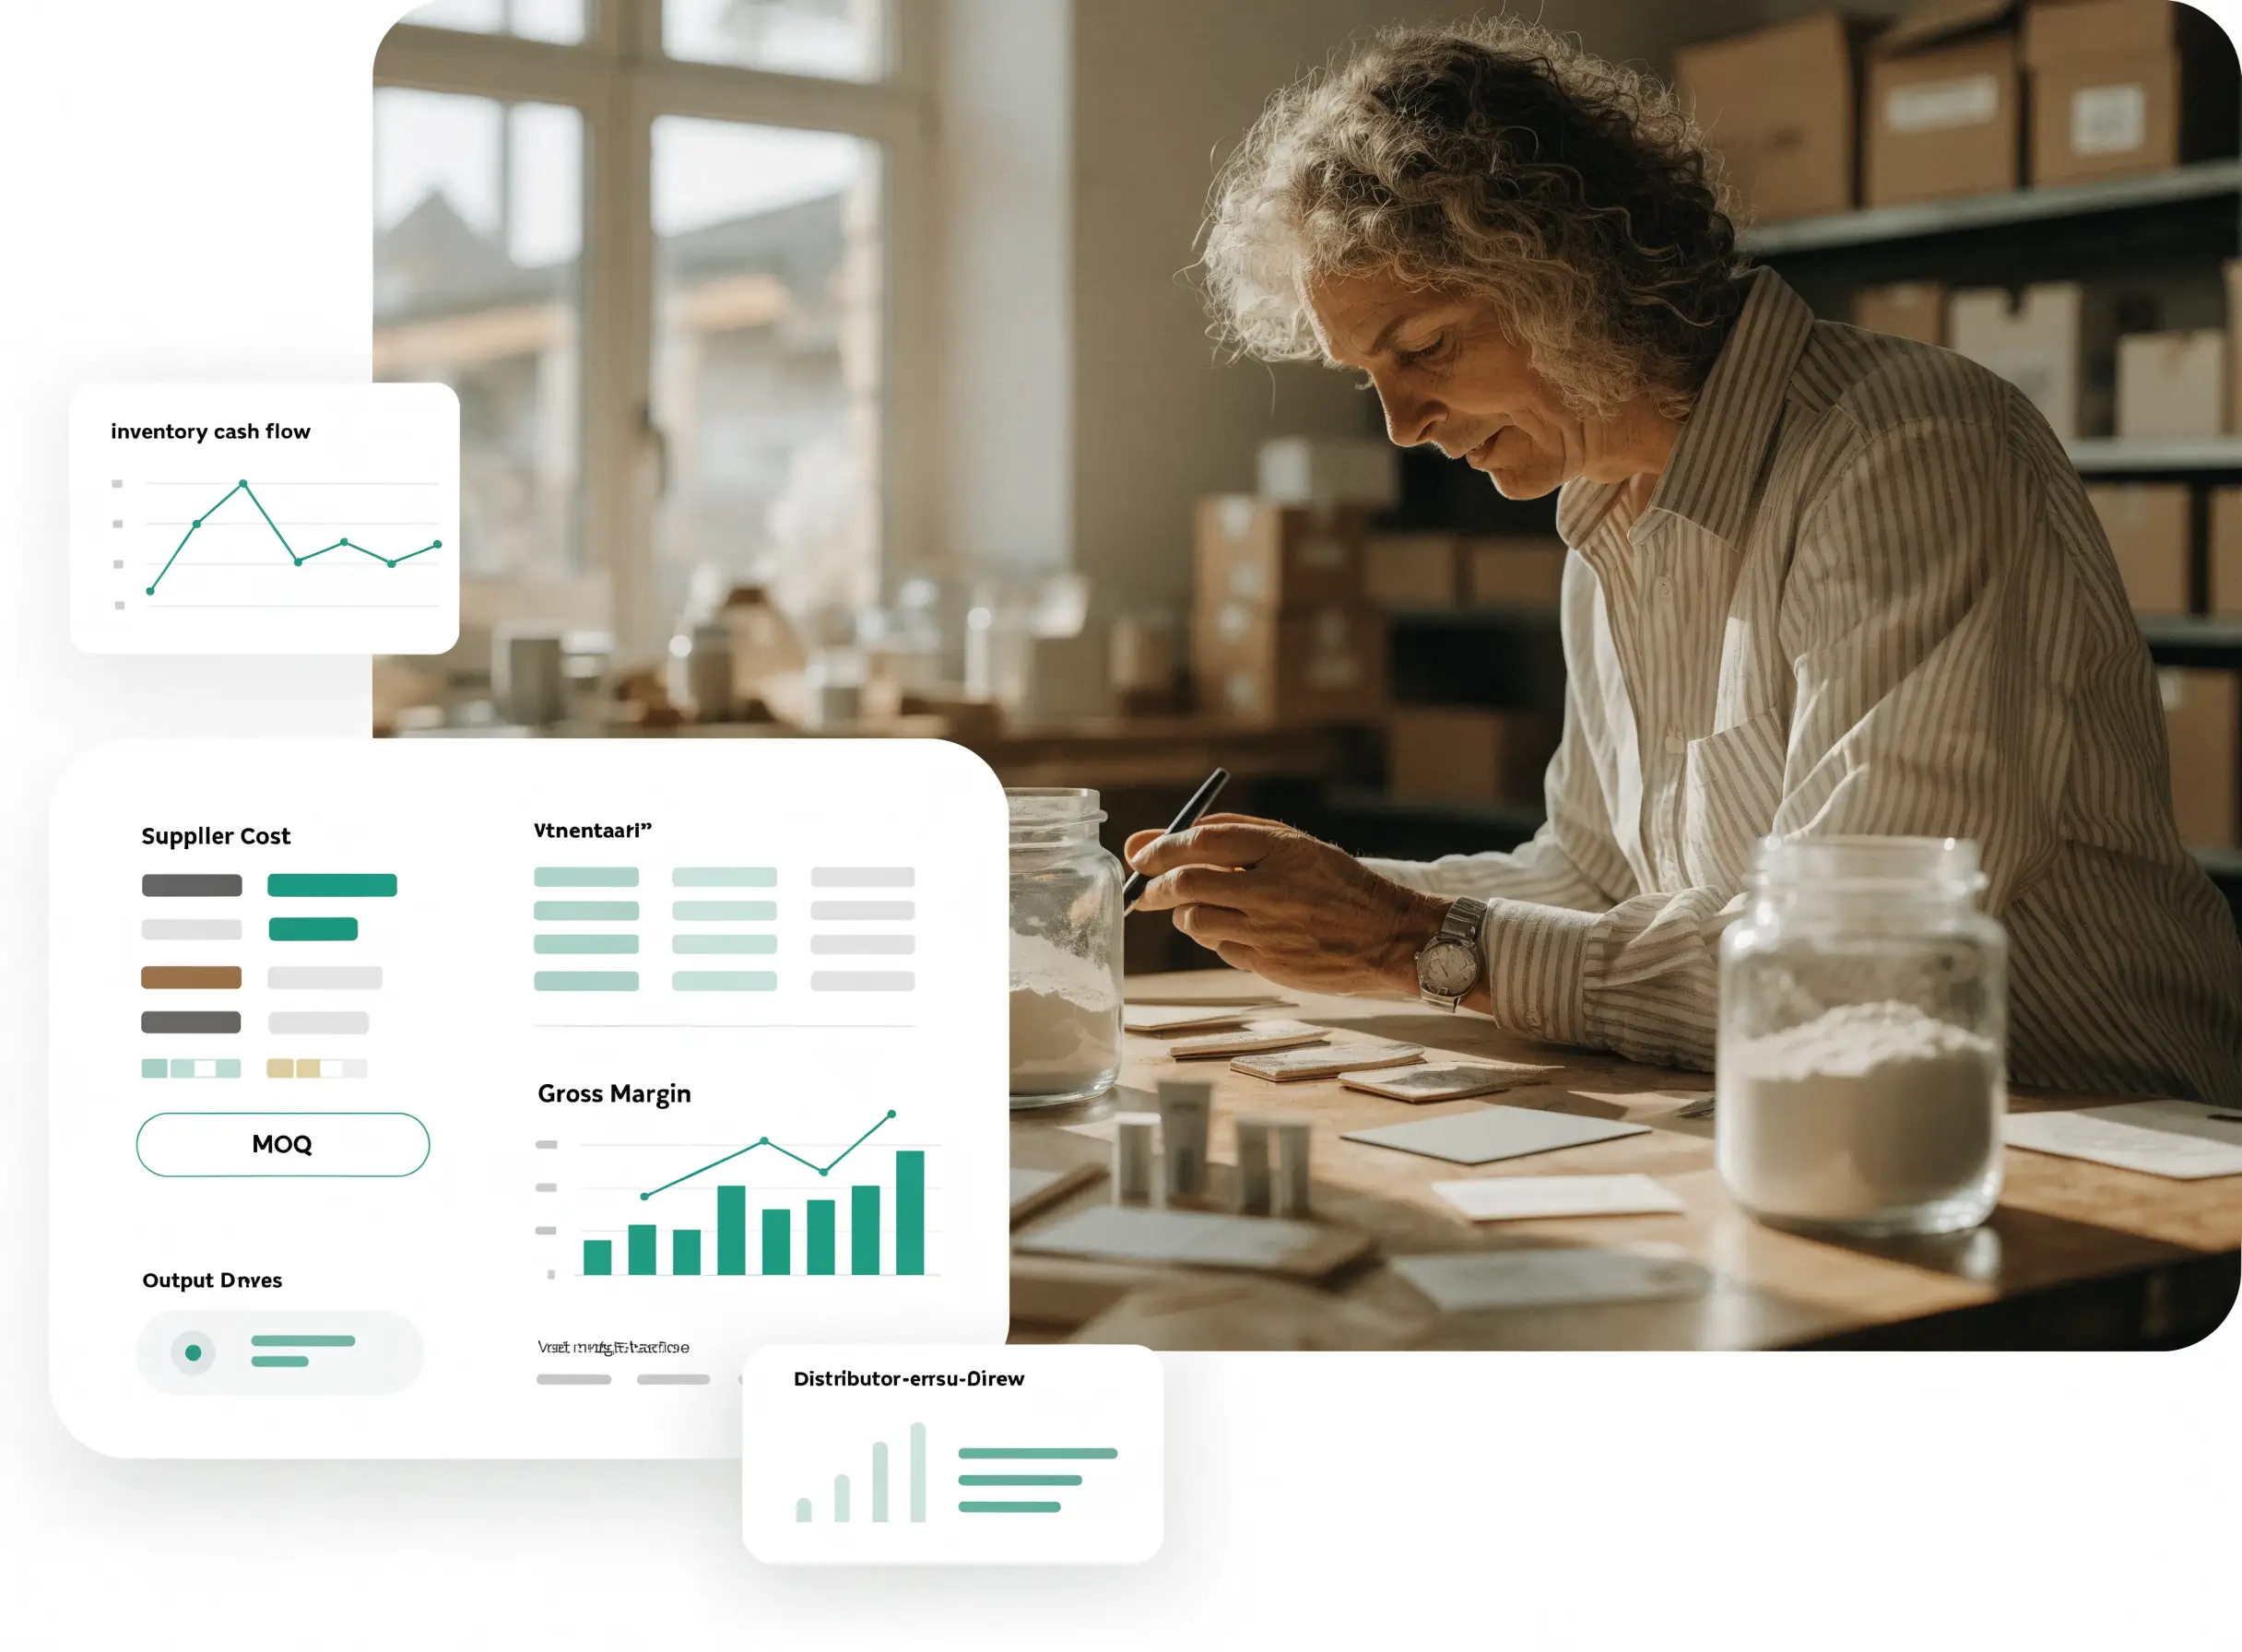
CPG margin & cash model
Illustrative example.
When the production run is due
The cash a run ties up, and how long until retailers pay.
A production run is paid for months before retailers pay you. This shows how long that cash is gone.
- Production & MOQs
- Channel margin stack
- Trade & volume discounts
Production and pricing calls you can make
Production, pricing and regional calls, each checked against net margin and the cash a run ties up.
What the CPG model covers
Production & MOQs
Model minimum order quantities and the cash they tie up against demand.
Channel margin stack
See what's left after distributor and retailer margins on every unit.
Trade & volume discounts
Plan promotions and volume tiers without guessing at the net.
Regional demand
Roll sales up by region so production matches where it sells.
From cost stack to regional forecast
- Step 1
Set the cost stack
Production cost, MOQs, and landed cost per unit.
- Step 2
Layer the channels
Distributor and retailer margins, by channel.
- Step 3
Plan trade spend
Model promotions and volume discounts on net margin.
- Step 4
Forecast by region
Match production runs to regional demand.
More than a spreadsheet, more than a consultant
| Feature | Spreadsheetthe old way | Consultantbilled per engagement | Startup Suiteconnected workspace |
|---|---|---|---|
| Nested BOM → COGS → net margin | Manual | ||
| MOQ cash tied up and returned | Hard | ||
| Channel margin stack (distributor / retailer / DTC) | Tabs | ||
| AI mentor explains the production-cash risk | Hourly | ||
| CPG margin & cash model output |
- Nested BOM → COGS → net margin
- Manual
- MOQ cash tied up and returned
- Hard
- Channel margin stack (distributor / retailer / DTC)
- Tabs
- AI mentor explains the production-cash risk
- CPG margin & cash model output
- Nested BOM → COGS → net margin
- MOQ cash tied up and returned
- Channel margin stack (distributor / retailer / DTC)
- AI mentor explains the production-cash risk
- Hourly
- CPG margin & cash model output
- Nested BOM → COGS → net margin
- MOQ cash tied up and returned
- Channel margin stack (distributor / retailer / DTC)
- AI mentor explains the production-cash risk
- CPG margin & cash model output
Pick the version closest to your business
Food & beverage
Shelf life, waste, and co-packing versus making it yourself: model perishable margins and run economics.
Sample output: Perishable margin model
Health & beauty
Premium positioning and retailer margins: model the stack from formula cost to shelf price.
Sample output: Retail margin stack
Distributor-led
Volume tiers and trade spend: model net margin after distributor and promotional discounts.
Sample output: Trade-spend model
CPG + DTC hybrid
Wholesale plus your own site: model blended margin and working capital across both channels.
Sample output: Blended channel model
See the CPG + DTC hybrid modelCPG modelling questions
Can it model distributor and retailer margins?
It's designed to. The full channel margin stack is modelled, so you see what's left at net on every unit.
Does it handle MOQs and production cash?
It's built to. Minimum order quantities and the cash they tie up are modelled against demand and runway.
What is a CPG financial model?
It rolls ingredients, packaging and co-packing (the bill of materials, or BOM) into a unit cost, takes off distributor and retailer margins to reach net, and models MOQ cash and trade spend, so you see the margin you keep.
Is this just a spreadsheet template?
No. A template prices one run at one cost. Here an ingredient rise and a bigger run sit side by side, and you can see which one leaves the bank balance short before stock sells.
Can it compare distributor vs DTC margin?
It's designed to. Model wholesale and DTC channels together and see the blended margin and working capital across both.
Related business models
See all solutionsSee your margin from production run to shelf
Enter your bill of materials and channel margins, and see net margin per unit and the cash each run ties up.