Forecast Growth Without Guessing
Growth forecasting becomes more credible when it is tied to real acquisition drivers, conversion assumptions, retention, and capacity. Rather than drawing a hopeful curve, quantify demand, conversion, and price so the forecast traces back to inputs you can defend.

On this page
- Tie growth to acquisition drivers, conversion, retention, and capacity.
- A top-line curve with no drivers behind it is a guess.
- Keep the assumptions traceable so the forecast can be questioned and updated.
- Connect growth assumptions to their financial consequences.
What this means
Founders often use a top-line growth curve without showing where it comes from. A credible forecast works the other way around: it builds growth from the drivers that actually produce customers, such as lead volume, conversion, and retention.
Spreadsheet limitations
| Feature | Startup Suitedriver logic | A spreadsheetthe manual way |
|---|---|---|
| The curve | Preserves the driver logic behind the chart | Can show a chart |
| Assumptions | Traceable growth inputs | Easy to present outcomes without assumptions |
- The curve
- Preserves the driver logic behind the chart
- Assumptions
- Traceable growth inputs
- The curve
- Can show a chart
- Assumptions
- Easy to present outcomes without assumptions
Consultant limitations
| Feature | Startup Suitefounder-owned | A consultantadvisory |
|---|---|---|
| Best for | Routine forecast updates | Growth strategy advice |
| As a tool | Integrated with the model | Less useful as a founder-owned operating tool |
- Best for
- Routine forecast updates
- As a tool
- Integrated with the model
- Best for
- Growth strategy advice
- As a tool
- Less useful as a founder-owned operating tool
How Startup Suite helps
Startup Suite's Forecast Engine connects growth assumptions to their operational and financial consequences, so a change in conversion or retention flows straight through to revenue and cash.
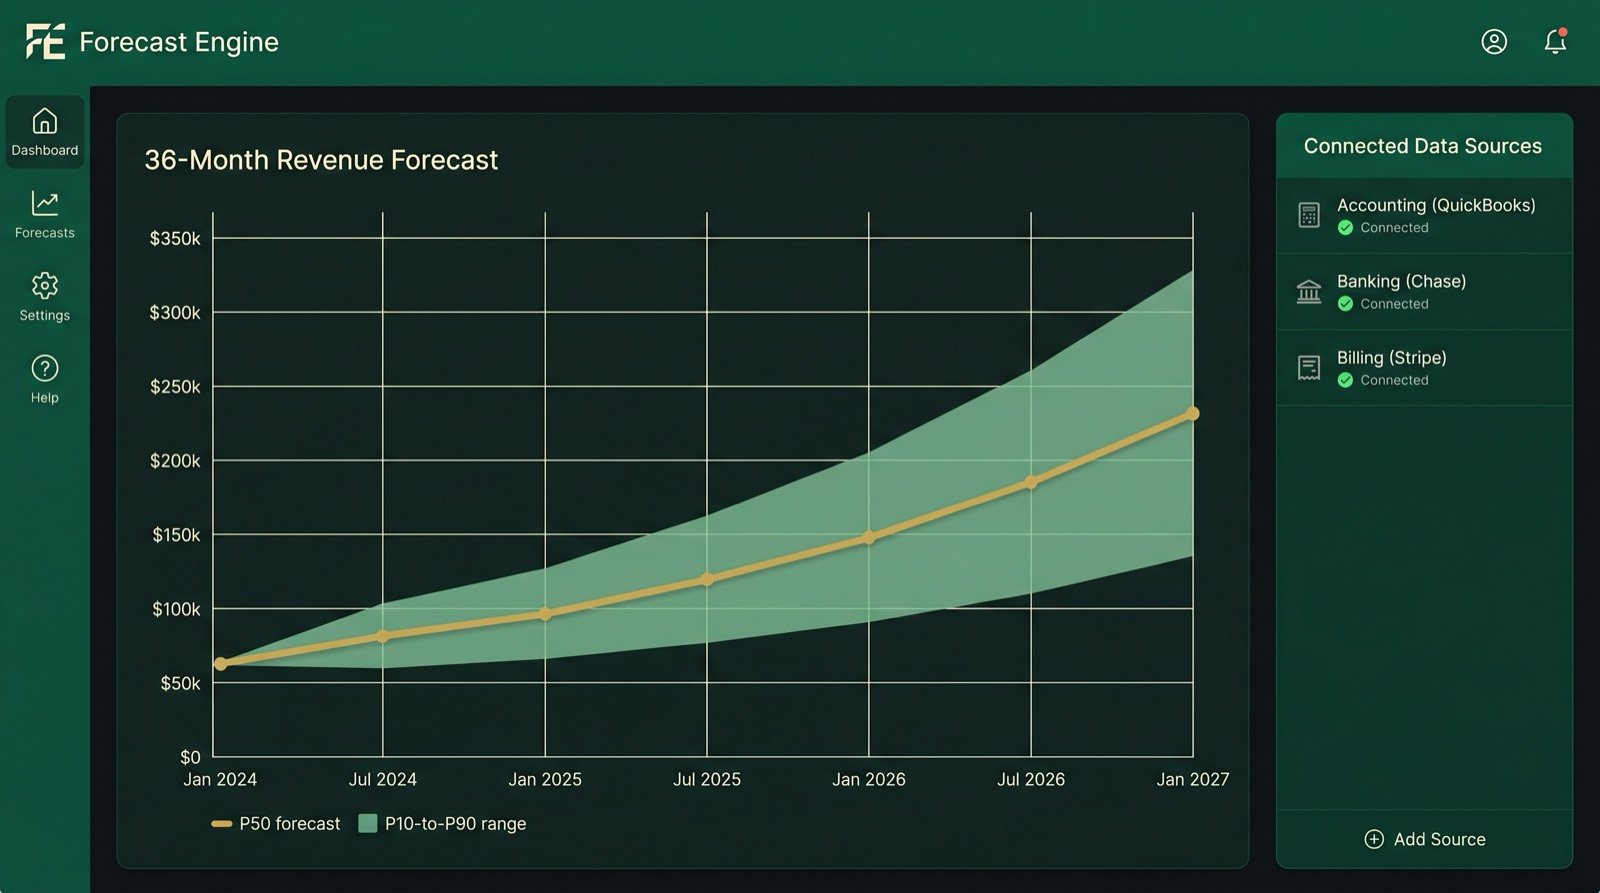
Forecast Engine: growth you can trace
- Build the curve from leads, conversion, and retention.
- See the revenue each driver produces, not just a trend line.
- Update one assumption and watch the whole forecast respond.
A practical founder example
Suppose qualified leads are 1,000, the meeting rate is 10 percent, and the close rate is 20 percent. New customers are 1,000 times 10 percent times 20 percent, which is 20. If average revenue per account is 99 dollars, new monthly recurring revenue is 20 times 99, which is 1,980 dollars.
Every part of that number is a lever you can pull: more leads, better conversion, or higher price. A bare growth curve hides all three.
Watch the 60-second summary
Forecast growth without guessing
Frequently asked questions
What drives a credible growth forecast?
Real acquisition drivers: lead volume, conversion rates, retention, and capacity.
Is a hockey-stick curve ever justified?
Only if the drivers behind it are realistic and explainable, not assumed.
How often should I update it?
Regularly. As real conversion and retention data arrive, feed them back into the drivers.
Still have questions? Talk to the team.