Build a 3-Year P&L Forecast
A three-year P&L forecast shows how revenue, cost of revenue, operating expenses, and operating profit evolve over time. Use more specific monthly or quarterly detail in the first year, then longer-range views for years two and three. A P&L is useful only when it stays driver-based and explainable.

On this page
- A 3-year P&L tracks revenue, cost of revenue, operating expenses, and operating profit over time.
- Use monthly or quarterly detail in year one, longer-range views after that.
- Build it from a few drivers, not row-by-row manual complexity.
- Keep it driver-based and explainable, or it stops being useful.
What this means
Founders often know their year-one hopes but have no view of how the business scales through years two and three. A three-year P&L closes that gap by projecting revenue, cost of revenue, operating expenses, and operating profit across the period, so the trajectory is visible rather than assumed.
Build years two and three from reasoned assumptions about:
- Revenue growth
- Margin improvements
- Headcount changes
- Overhead growth
Spreadsheet limitations
| Feature | Startup Suitedriver-based | A spreadsheetthe manual way |
|---|---|---|
| Structure | Connects P&L lines to assumptions cleanly | Can house P&L lines |
| Approachability | Guided, founder-friendly forecasting | Often dense and intimidating |
- Structure
- Connects P&L lines to assumptions cleanly
- Approachability
- Guided, founder-friendly forecasting
- Structure
- Can house P&L lines
- Approachability
- Often dense and intimidating
Consultant limitations
| Feature | Startup Suiteownership | A consultantspecialist |
|---|---|---|
| Cadence | Built for ongoing updates | Can build the forecast once |
| Ownership | Day-to-day founder ownership | Specialist-heavy |
- Cadence
- Built for ongoing updates
- Ownership
- Day-to-day founder ownership
- Cadence
- Can build the forecast once
- Ownership
- Specialist-heavy
How Startup Suite helps
Startup Suite's Forecast Engine structures a three-year P&L around a few core drivers instead of row-by-row manual complexity, so the forecast stays readable as the years extend.
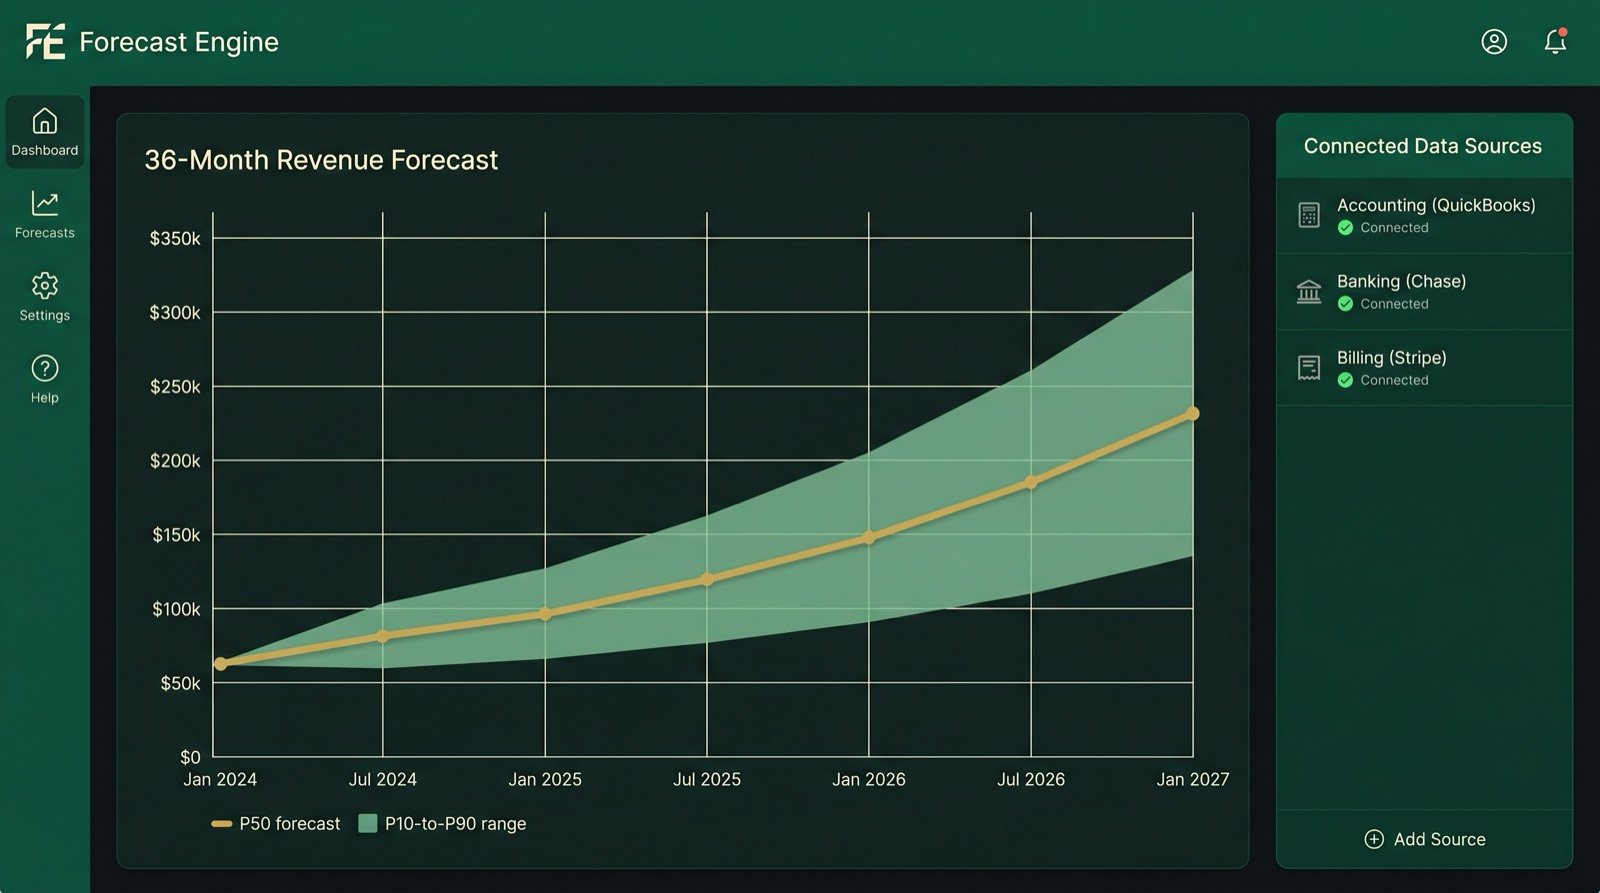
Forecast Engine: a P&L that scales with you
- Drive three years of P&L from a handful of assumptions.
- Keep year one detailed and later years high-level in the same model.
- Update one driver and watch every year respond.
A practical founder example
Say year-one revenue is 240,000 dollars at a 65 percent gross margin, so gross profit is 240,000 times 65 percent, or 156,000 dollars. With operating expenses of 190,000 dollars, the operating result is 156,000 minus 190,000, which is negative 34,000 dollars.
Repeat for years two and three with reasoned assumptions for revenue growth, margin improvements, headcount, and overhead. The structure stays the same; only the drivers change.
Watch the 60-second summary
Build a 3-year P&L forecast
Frequently asked questions
How detailed should year one be?
Use monthly or quarterly detail in year one, then longer-range views for years two and three.
Do I need all three statements?
A P&L is a strong start, but pair it with a cash view so timing surprises do not catch you out.
What keeps a long forecast credible?
Keeping it driver-based and explainable, so every line traces back to an assumption.
Still have questions? Talk to the team.